Using Dashboards in HSE
In today's world, information plays a key role in business, science, education, and many other fields. Data processing and analysis have become an integral part of our lives. Dashboards are one of the most popular and effective tools for working with data. They allow for a quick assessment of the current state of affairs and the identification of trends and patterns. Thanks to the use of various graphs, charts, and tables, information becomes accessible and understandable even to those without a specialized education in data analysis and can be useful even in the field of HSE. Today, as a continuation of my series of articles on promising technologies in HSE, I would like to tell you about this inexpensive and highly visual tool.
What is a dashboard?
A dashboard is a tool for data visualization and analysis that allows you to quickly obtain information about the state of an organization within the analyzed data stream. It is a panel with graphs, charts, tables, and other elements that display key performance indicators at workplaces. Dashboards can be either simple or complex, depending on the company's needs and the specifics of its activities.
Dashboards are used in many industries, including business, science, medicine, education, and others. They help analyze data, track changes, identify trends, and find patterns.
Using dashboards in the field of HSE has several well-founded advantages:
- First, they allow for a quick visual assessment of the safety status at the workplace and the identification of potential non-trivial problems.
- Second, dashboards help your managers make informed decisions, including those based on data analysis.
- Third, they encourage employees to comply with HSE rules, as they see how their actions affect the overall picture, since information through a dashboard can be analyzed down to the smallest detail.
- The effectiveness of using dashboards depends on several factors. First of all, it is necessary to correctly set up the data collection and processing system. It is important to use up-to-date and reliable information sources, such as incident reports, audit results, etc. It is also necessary to regularly update the data on the dashboard so that it remains relevant and accurate.
Types of HSE Dashboards
There are several types of dashboards that can be useful and used in the field of HSE. Here are some that might be useful to you:
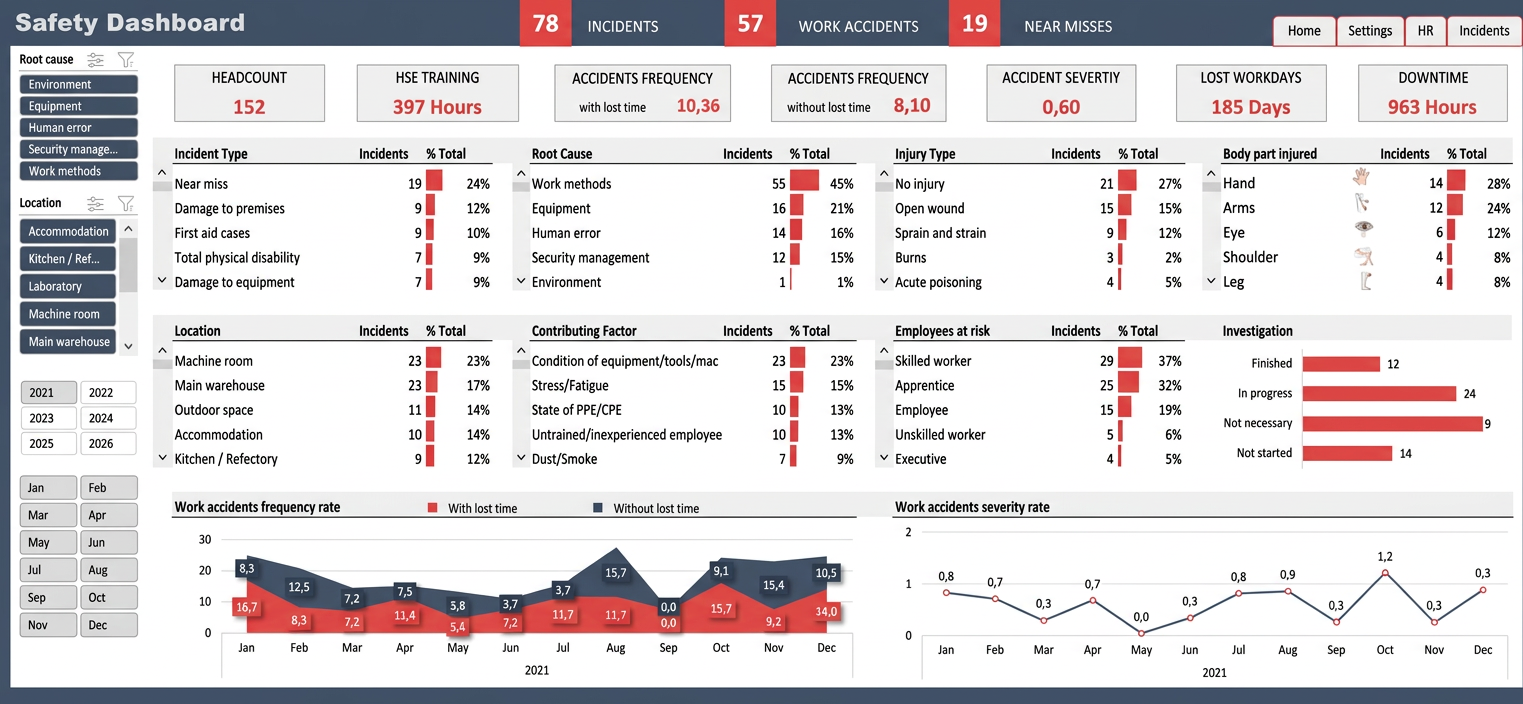
- Occupational Safety Dashboard – displays statistics on the number of incidents, their causes, and consequences; useful for identifying causes and patterns;
- Working Conditions Dashboard – shows levels of lighting, noise, temperature, and other parameters at all workplaces and work zones; useful for monitoring and analyzing the causes of accidents and incidents;
- Training and Certification Dashboard – reflects the number of people trained, successfully passed exams, problematic issues, etc.;
- Compliance Monitoring Dashboard – contains information on conducted inspections, identified violations, and measures taken;
- Risk Management Dashboard – allows for the assessment of the probability of hazardous situations and the development of measures to prevent them.
If you combine all this data into a single dashboard, you will get a powerful additional tool for data analysis.
How to create an effective dashboard?
To create an effective dashboard, several steps must be taken. First, define the goals and objectives that the dashboard should solve. Second, choose suitable tools for data collection and analysis. Third, develop the structure and design of the dashboard so that it is easy to perceive and use. Fourth, set up automatic data processing and updates. The most effective dashboards can even be created using Excel!
Pros of dashboards:
- Data visualization - dashboards present information in an easy-to-understand format, facilitating its analysis;
- Interactivity - dashboards are usually interactive, allowing users to quickly change parameters and see how it affects the results;
- Real-time data updates - information on dashboards is updated automatically, ensuring data relevance.
Cons of dashboards:
- Setup complexity - creating an effective dashboard may require time and effort for configuration and integration with data sources;
- Need for training - not all users can immediately understand how to work with a dashboard, especially if it contains complex graphs and tables;
- Security issues - if the data on the dashboard is not protected, it could lead to the leakage of confidential information.