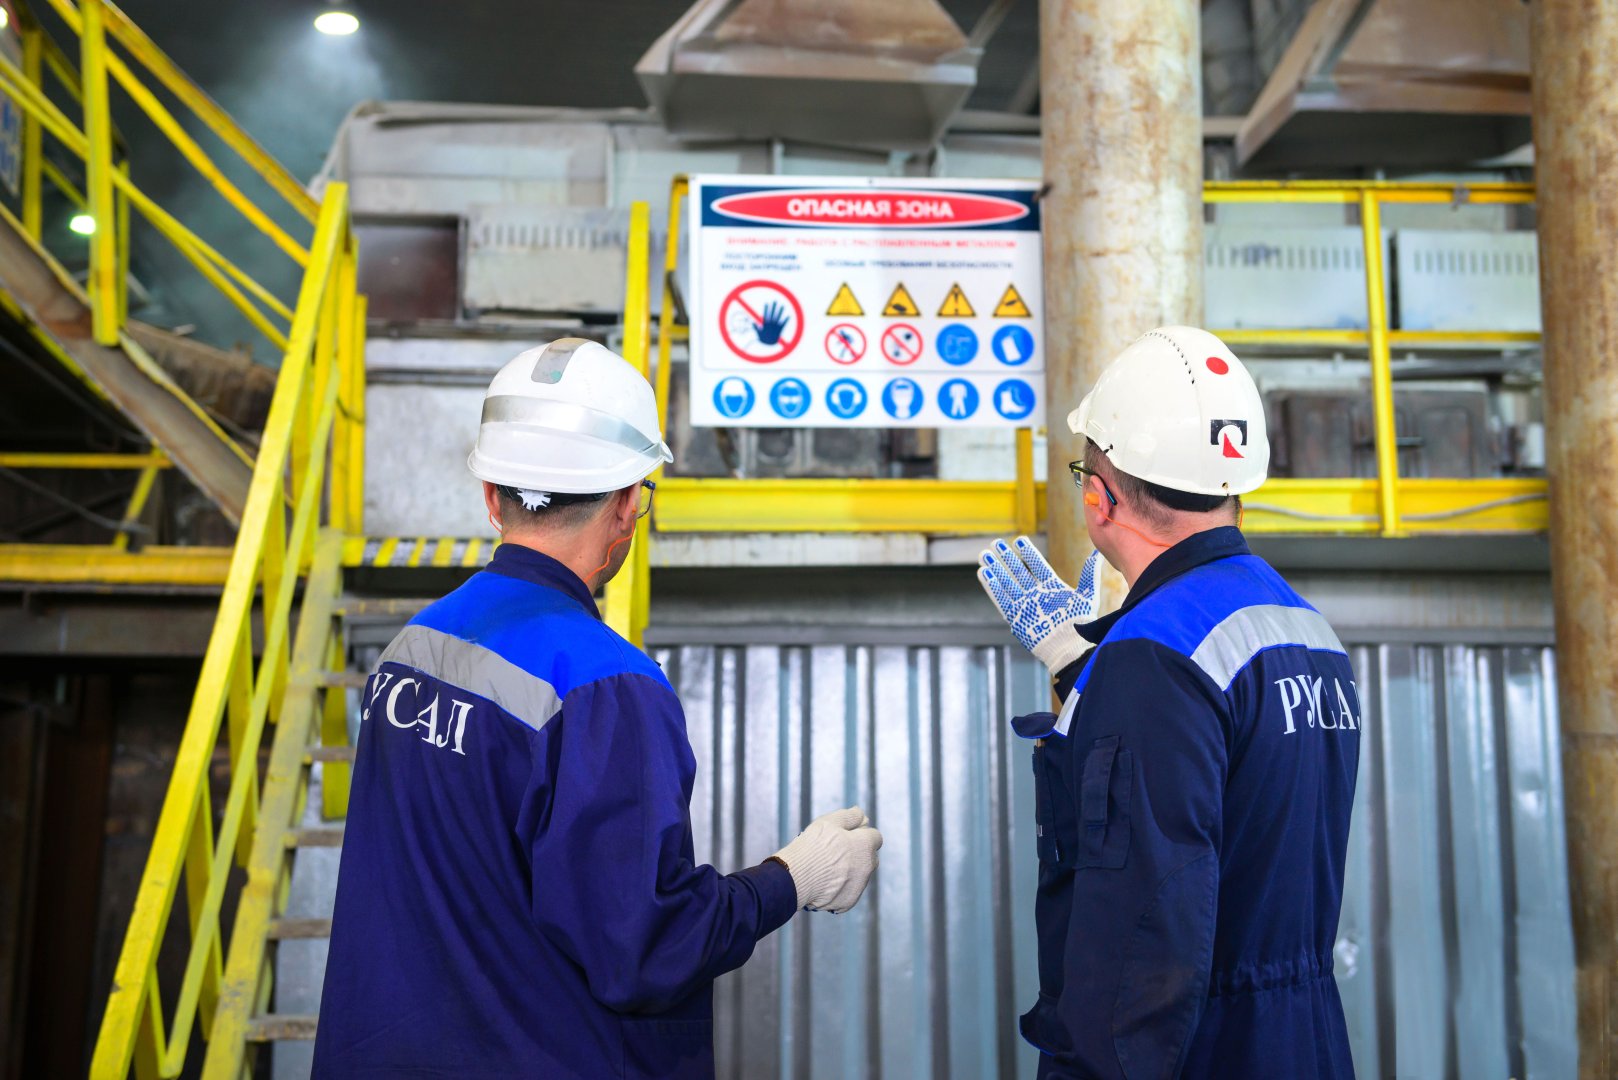
🛡️Safety: Visual safety management at RUSAL — sharing our experience
Have you ever seen rusty, dented, faded safety signs taped to the shop gates with torn sticky tape?
Have you ever thought about the effect such “visual campaigning” produces (figure 1)?
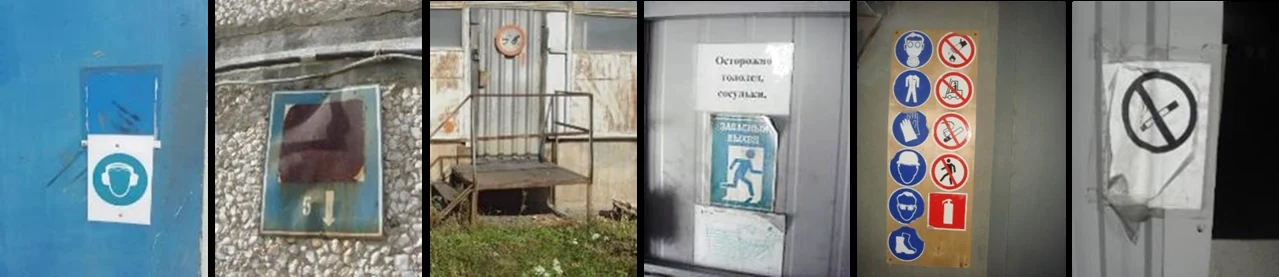
Employees read the meaning of that picture instantly, and they take it as a clear position of management: “Your safety is of no interest to anyone here — forget about it!”.
The outcome is predictable: the rules lose their authority, and disregard for safety requirements becomes the norm of everyday behaviour.
That is how a culture of “unsafe work” takes shape…
To overcome this problem, my colleagues and I decided to set up visual safety management.
Visual safety management is a system of colour, graphic, text, light, sound and other indicators that informs employees about hazards and about the requirements for safe behaviour.
1. The management programme
Our goal was to make the key hazards and the rules of safe behaviour visible and intuitively clear.
For that we developed a dedicated corporate programme “Marking of hazards, signs and floor marking”.
Its foundation was a single corporate standard that we developed on the basis of GOST 12.4.026-2015 and POT RO-14000-007-98. It defined a clear procedure for visualising risks at workplaces, in the shops and across the site.
- Scale: 11 plants of RUSAL’s Downstream Division (about 8,000 employees).
- Duration: roughly 2.5 years.
- Resources: we managed with our own people.
- Budget: OPEX (maintenance), without fighting for dedicated funding.
2. The road from “Before” to “After”
We divided the whole process into three simple stages (figure 2).
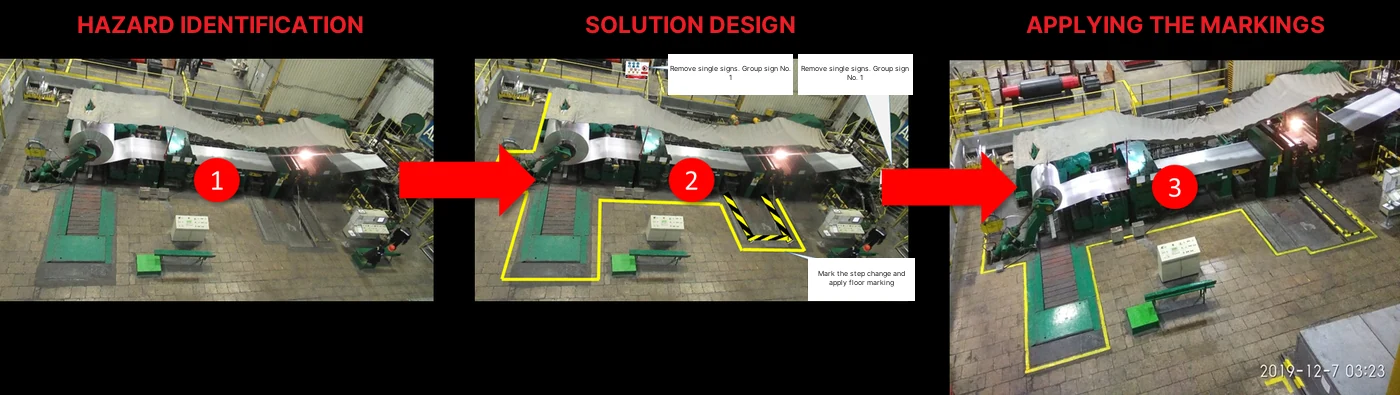
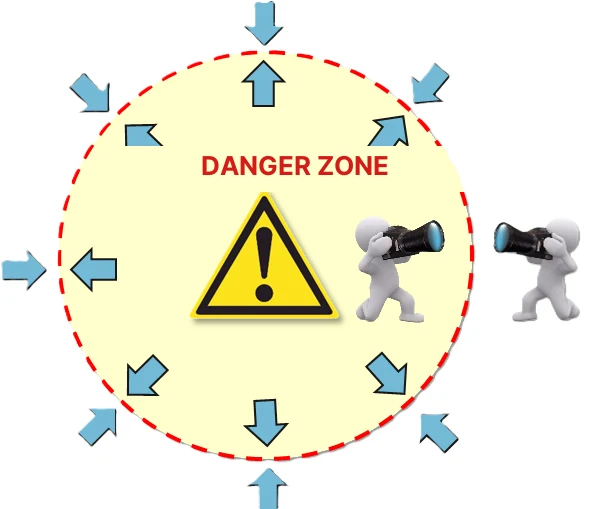
Stage 1: Identifying hazards. We walk through the production units and the site one by one — looking at the processes with a fresh eye.
Each shop has its own team:
- A manager.
- An experienced worker.
- An HSE specialist.
We photograph every hazardous area: from the outside, from the inside and from each entrance (figure 3).
Stage 2: Designing the solution. We load all the photos into PowerPoint. Right on the images we sketch the future signs, the marking lines and the dimensions (figure 4).
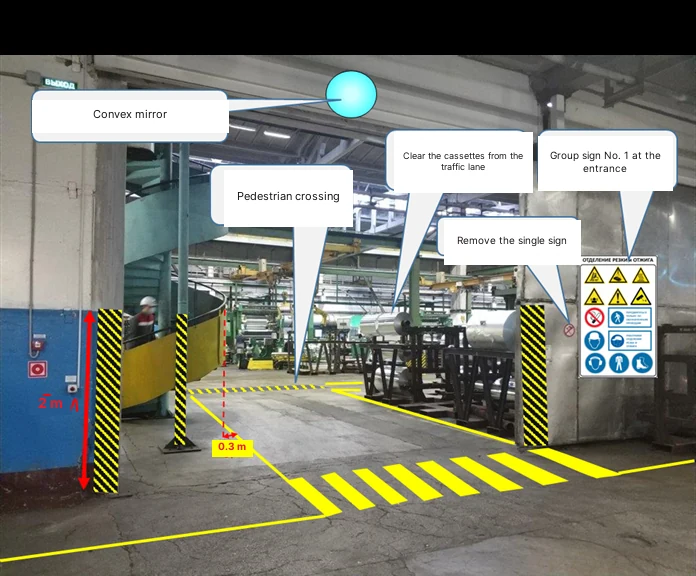
Our single Album of best practices, which we compiled for all the plants, is a great help here.
The final step is to agree the completed design with the occupational safety service.
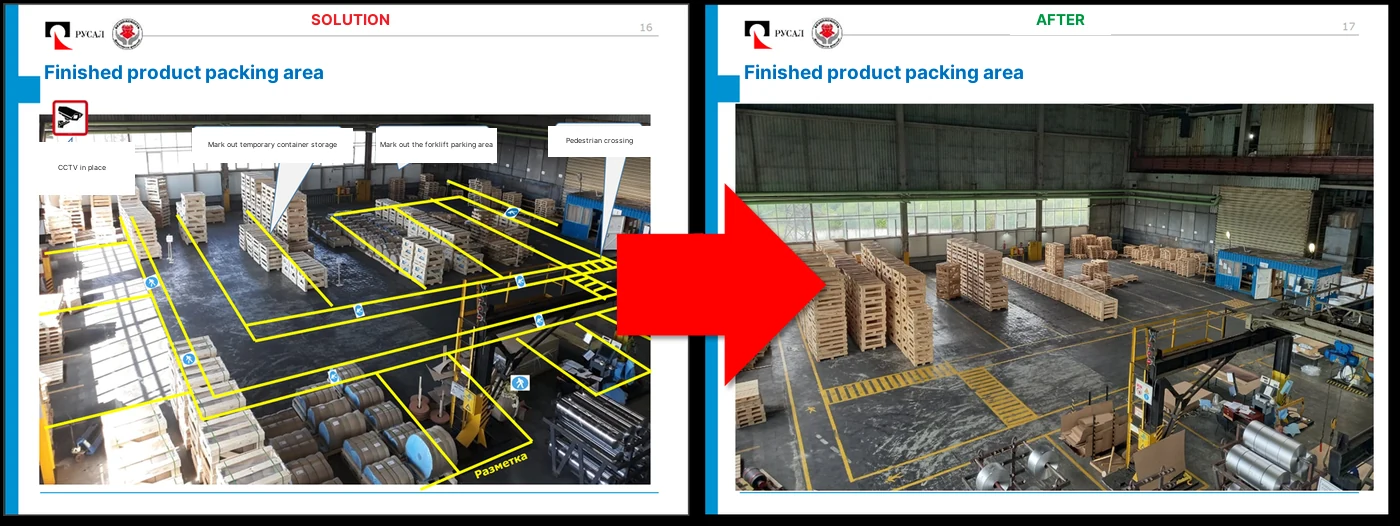
Stage 3: Applying the markings. Finally we get to the most interesting part (figure 5). We apply the visual elements and, if necessary, adjust them on the spot.
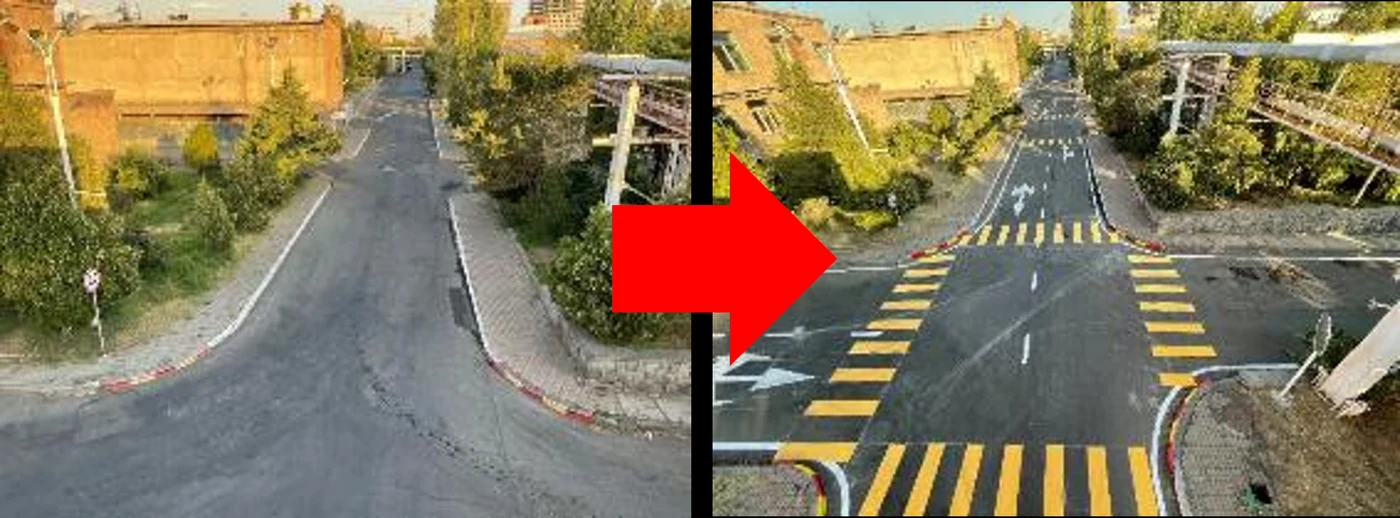
We photograph the final result again and add it to the presentation — this gives us a ready and visual “After” reporting format. This approach makes it possible to track the progress of the programme.
Besides, the “After” photo is an excellent way to record the final (design) state of the visual elements so that they can be renewed, restored or adjusted in the future.
3. Some standardised solutions
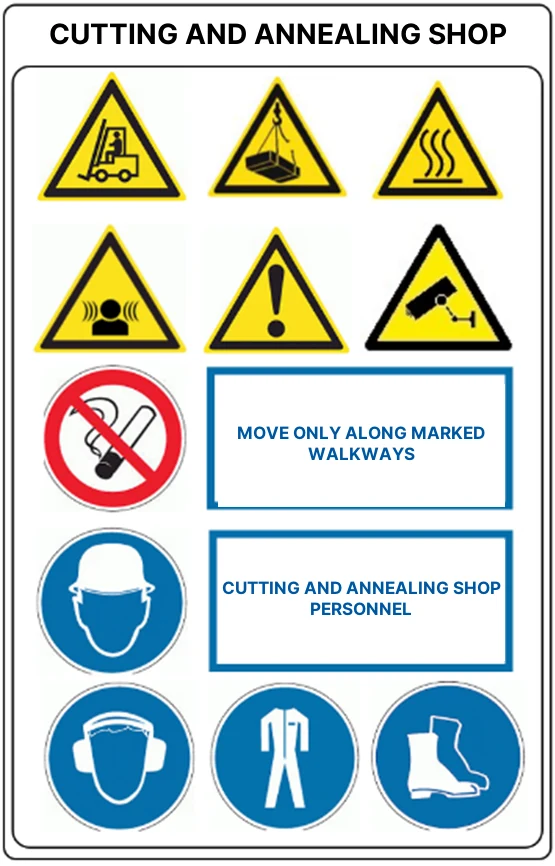
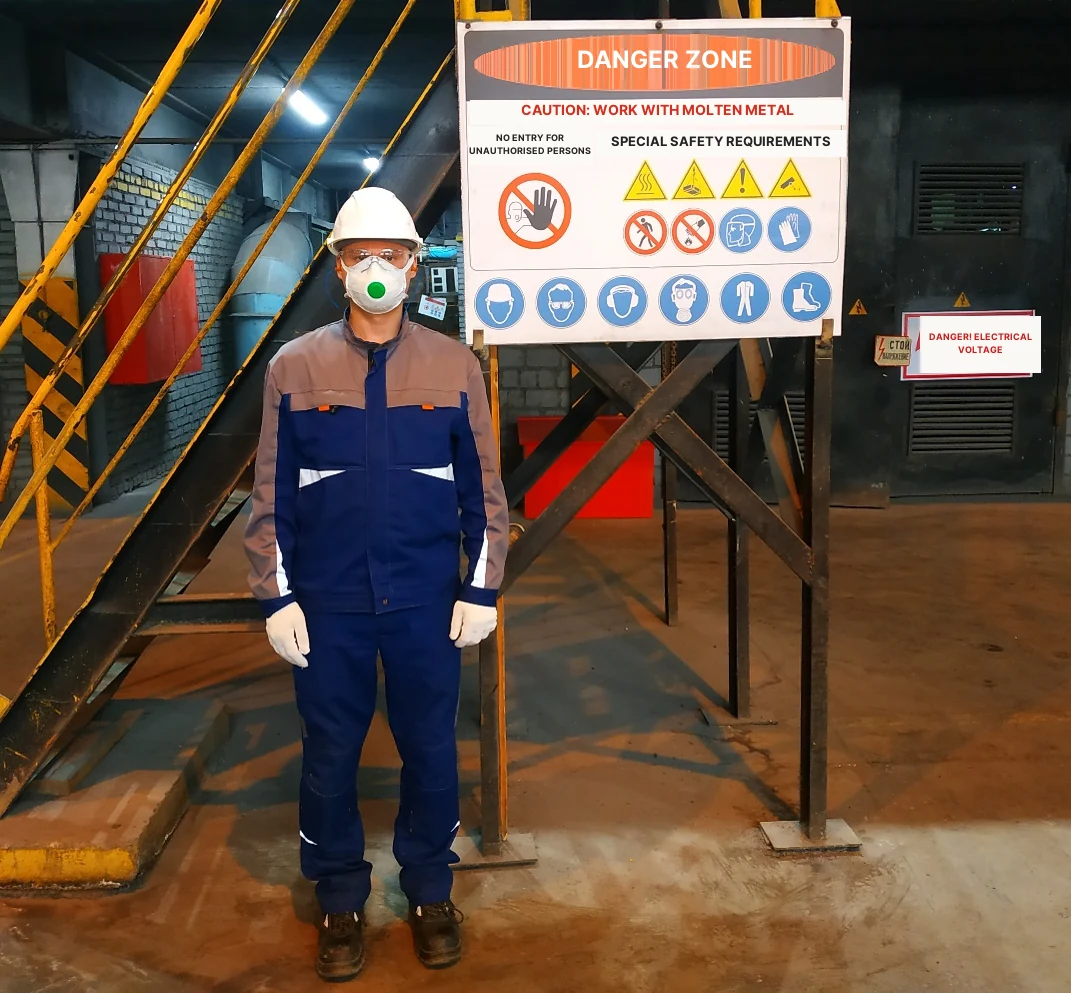
Group safety signs. These are rectangular boards (plastic or metal with stickers) that combine several signs and explanations. They are durable and, if needed, easy to update (figure 6). They are placed at least at every entrance to a unit and answer 3 main questions:
- What hazards may threaten a person entering the shop?
- What actions are prohibited inside it?
- What protective equipment must the person entering put on?
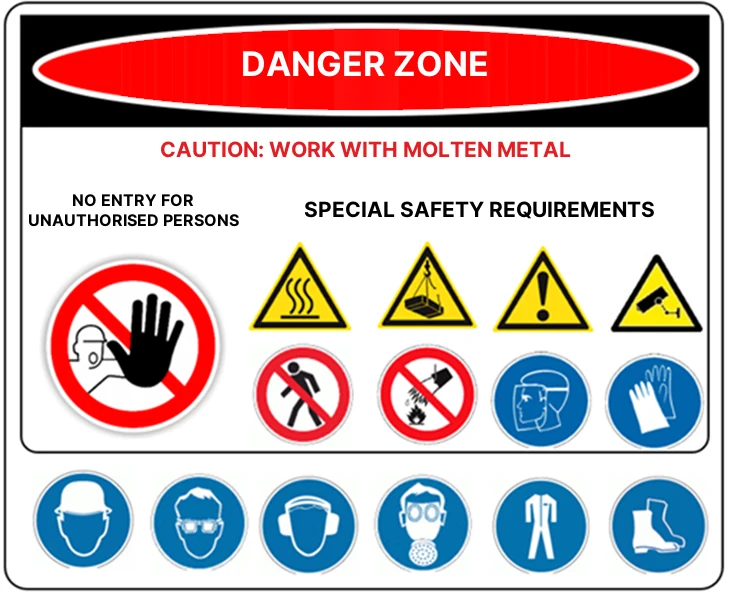
Hazardous process areas. Places where operations are carried out with explosive, flammable or toxic substances or with molten metals.
Here we deploy the maximum set of protective measures: from floor marking and group signs to barriers, light and sound alarms and CCTV. An example of a group safety sign is shown in figure 7.
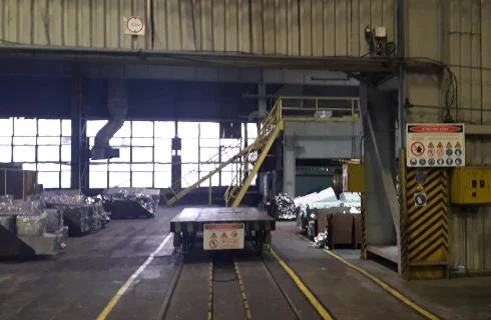
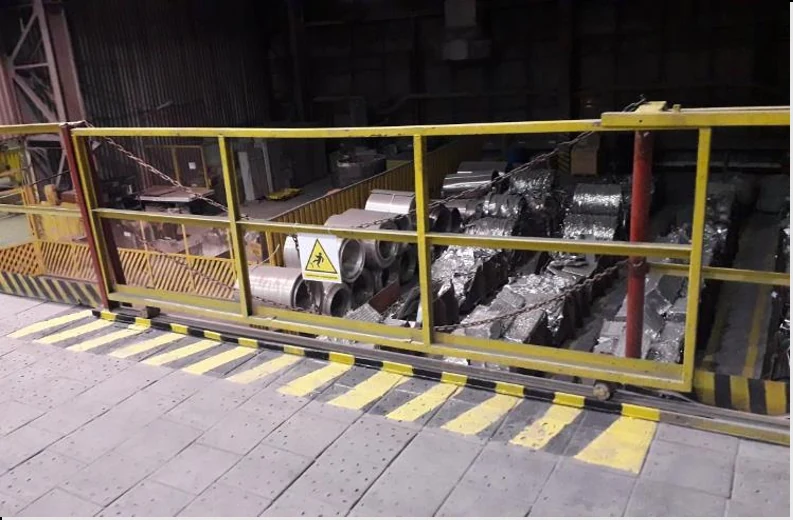
Hazardous work areas and equipment. Areas around machines and mechanisms where unauthorised people are not allowed. They are marked at least with floor marking and safety signs applied directly on the equipment or right next to it (figures 8 and 9).
NOTE: The safe sliding barrier (figure 9) was designed and installed in the course of our programme.
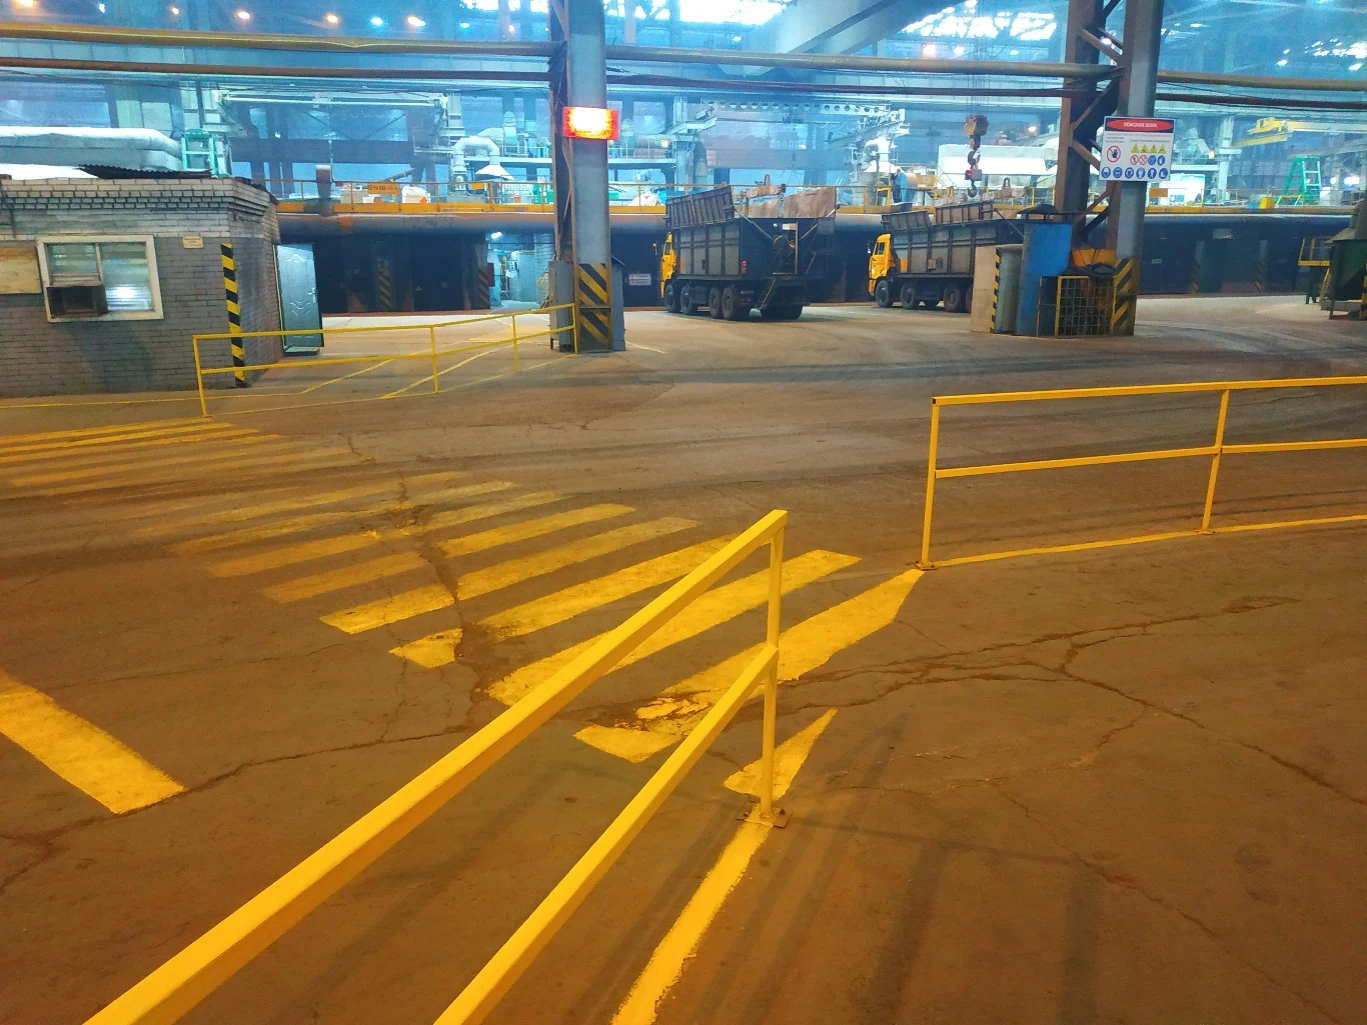
Protecting pedestrians. Installing guard rails, barriers, gates and bump stops that protect pedestrians — as well as equipment and structural elements of buildings — from accidental vehicle impact (figure 10).
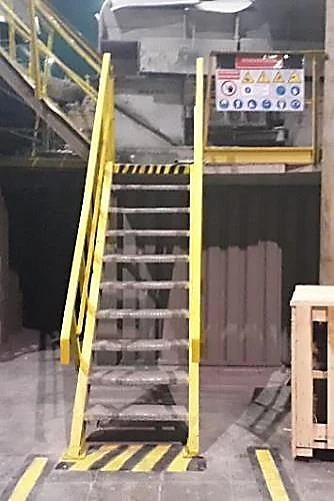
Stairways. We paint at least the top and the bottom step in a signal colour. The area in front of the bottom step is usually marked with a yellow and black stripe and must always be kept clear (figure 11).
4. Discipline and control
From the moment the marking is applied, its requirements become strictly binding for everyone: staff, contractors and visitors (figure 12). Control rests with line managers, and a breach of the visual management rules is treated as a disciplinary offence.
5. Key success factors
Visual management works effectively only when 7 conditions are met:
- No exceptions: top managers and line managers must follow the rules strictly themselves and demand the same from staff and contractors.
- Fitness and simplicity: the visual solutions must be clear even to an outsider. An excess of information only undermines trust.
- Involving the workforce: the solutions have to be developed together with the workers who work in those places every day.
- Standardisation: colours, fonts and signs must be uniform across the whole company.
- Proper condition: all visual elements must always be clean and in good order.
- Training: hanging a sign or painting a line is not enough — people have to be taught to “read” and understand this information quickly.
- Control: monitoring discipline in the units is a direct duty of line managers.
What our experience has shown
Visual management is a powerful tool for developing corporate culture. As they say in Odesa, a splendid thing! 😉
When it is organised properly, visual safety management:
- Changes the look of the plants. The shops look modern, tidy and attractive.
- Builds habits. Safe behaviour becomes a natural part of the daily work routine, a commonly accepted norm.
- Demonstrates priorities. It is visible, tangible evidence that management cares about its people, and a clear marker of a well-organised operation.
Colleagues, take it into your toolkit! 👍